
Grades 4–6 (P.4–P.6)
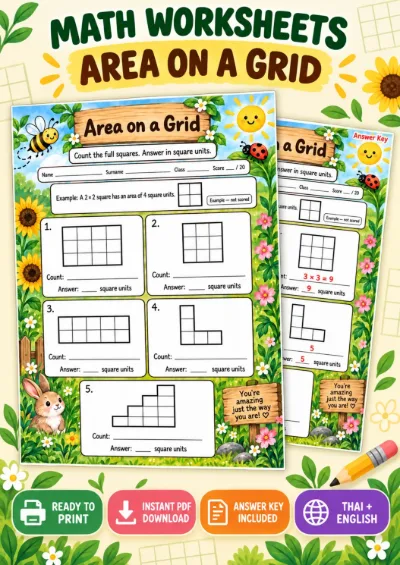
Area on a Grid - Count the Squares
19 Baht
View detailsMathematics
An AR classroom game for Grade 6. Learners can aim with their hands at the camera or play by tapping the screen.
This set has 4 rounds in an interactive sorting activity.
Curriculum indicatorค 3.1 ป.6/1
A look before you play
A few real prompts from the game to help you choose an activity for your class.
Sort into
A certain event has a probability of one; an impossible one has a probability of zero.
Sort into
The mean comes from adding and dividing; the mode comes from counting how often values occur.
Sort into
Negative numbers sit to the left of zero on the number line.
Before you play
Classify certain versus impossible events, mean versus mode by how they are found, positive versus negative numbers, and choose a line graph or pie chart for the data, linking to ค 3.1 ป.6/1.
4 sorting rounds, dragging 4 cards into 2 groups - Certain or impossible: less than 7 on a die, an 8 on a die, the sun rising tomorrow, a coin standing on edge for ever - Needs calculating or found by counting: mean, mode, total divided by count, most repeated value - Positive or negative: 5, -3, 12, -8 - Change over time or parts of a whole: daily temperature, students by stream, monthly sales, market share
Use after pie charts, as a game linking statistics and chance; about 5 minutes. - Play in teams; in round 4 have teams picture the graph they would draw for each card - In round 1, ask the highest number on a die to see why an 8 is impossible - In round 2, point out that two cards define the other two; pair them mentally first - Some items extend beyond primary indicators. Use them for discussion or preparation for Grade 7, not to judge attainment - Play it linked to the class to record results in the mark book.
- Round 1: 'less than 7 on a die' may be judged uncertain by children who think dice are always unpredictable - Round 2: the mode may go under needs calculating, as children assume every statistic is calculated - Round 4: 'students by stream' may puzzle Grade 6, since streams (science, arts) belong to upper secondary
Grades 4–6 (P.4–P.6)
Grades 4–6 (P.4–P.6)
Grades 4–6 (P.4–P.6)
 Multiple choice
MathematicsGrade 16 questions
 Multiple choice
MathematicsGrade 16 questions
 Ordering
MathematicsGrade 14 rounds
 Sorting
MathematicsGrade 14 rounds