
Grades 4–6 (P.4–P.6)
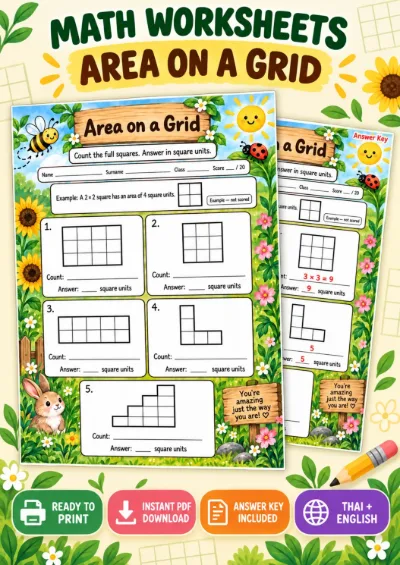
Area on a Grid - Count the Squares
19 Baht
View detailsMathematics
An AR classroom game for Grade 4. Learners can aim with their hands at the camera or play by tapping the screen.
This set has 4 rounds in an interactive sorting activity.
Curriculum indicatorค 3.1 ป.4/1
A look before you play
A few real prompts from the game to help you choose an activity for your class.
Sort into
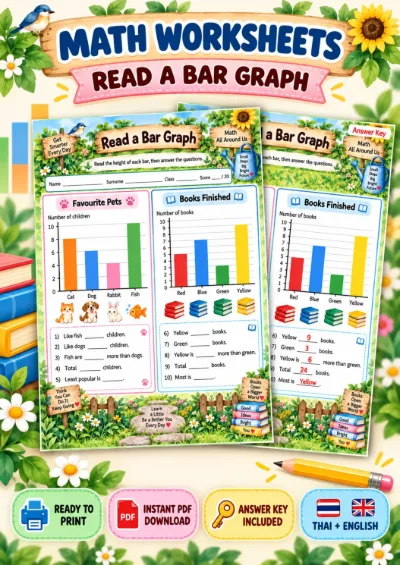
A bar chart compares amounts; a pie chart shows parts of a whole.
Sort into
A number divides by four exactly when its last two digits do.
Sort into
Compare with a thousand - anything with four digits or more is greater.
Before you play
Choose a suitable kind of chart for some data, with review of dividing by 4, comparing numbers with 1,000, and telling units of length from units of area.
4 sorting questions with 2 boxes each - Students in each class and daily sales suit a bar chart; which colours children prefer and how a day is divided suit a pie chart - 16 and 36 divide exactly by 4; 18 and 22 do not - 876 and 999 are less than 1,000; 1,240 and 3,050 are more - Metre and centimetre are units of length; square metre and square centimetre are units of area
This set contains no chart to read. Use it as a light 5-minute review before a bar chart lesson, team mode. - For Q1, have an example bar chart and pie chart ready to project, since P4 pupils have not learned pie charts - For area units, draw a 1 cm square on paper to show how it differs from 1 cm - Play it linked to the class to record results in the mark book
- Putting "which colours children prefer" under bar chart, which is also valid. Hear the reasoning and explain that "proportion" in the Thai wording points to a pie chart - Putting square metre under length because it contains "metre". Underline "square" - Putting 18 under "divides by 4" because it is even
Grades 4–6 (P.4–P.6)
Grades 4–6 (P.4–P.6)
Grades 4–6 (P.4–P.6)
 Multiple choice
MathematicsGrade 16 questions
 Multiple choice
MathematicsGrade 16 questions
 Ordering
MathematicsGrade 14 rounds
 Sorting
MathematicsGrade 14 rounds